


Resilient rejection rates illustrate truckload capacity’s decline
Truckload demand has stumbled over the winter, which has only helped keep capacity in a strong state of contraction – more than many realize. The post Resilient rejection rates illustrate truckload capacity’s decline appeared first on FreightWaves.

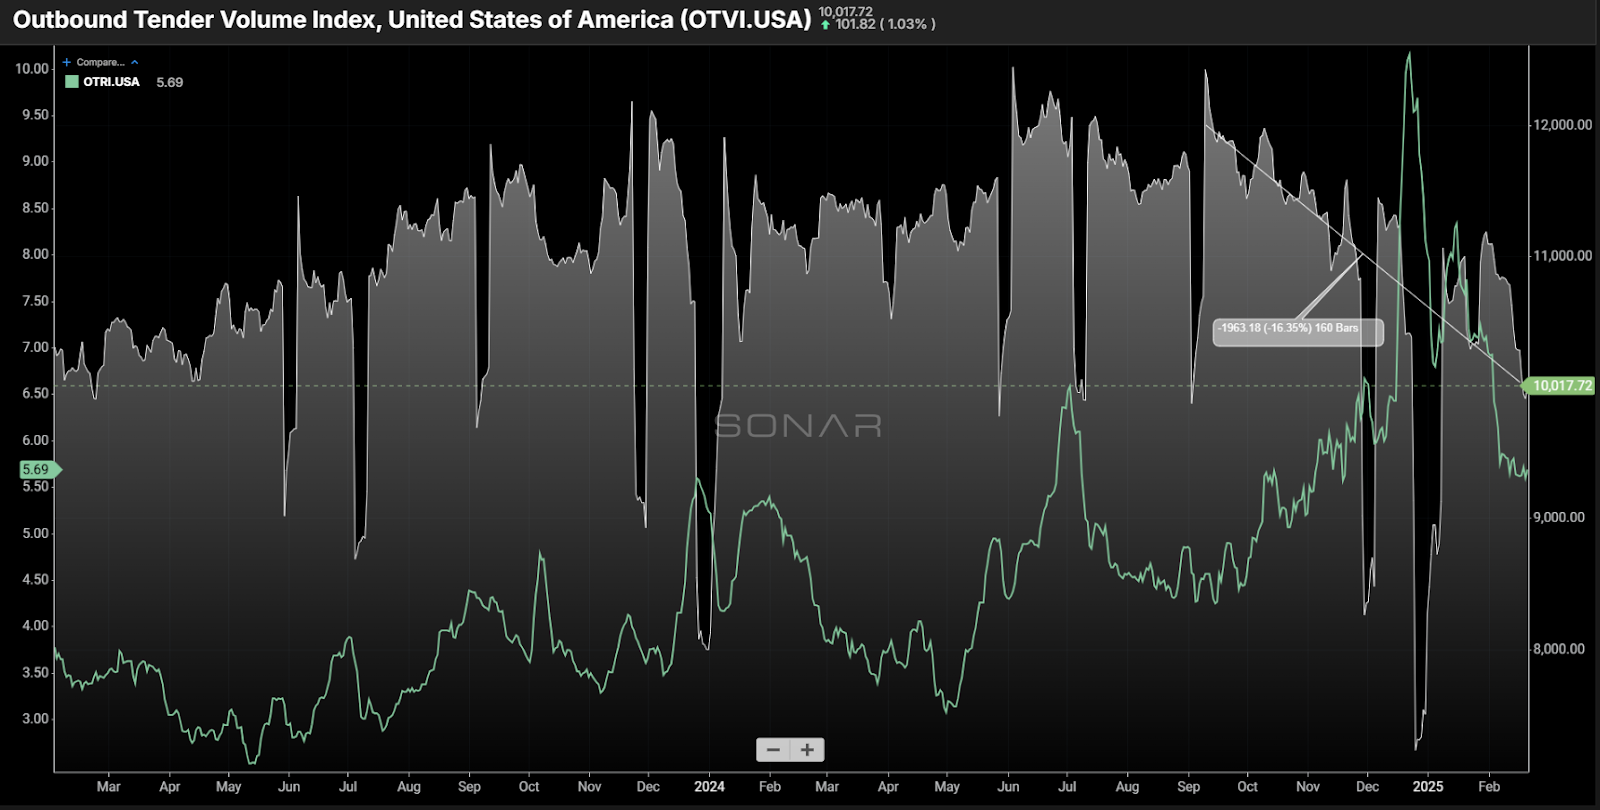
Chart of the Week: Outbound Tender Reject Index, Outbound Tender Volume Index – USA SONAR: OTVI.USA, OTRI.USA
Requests for truckload capacity (OTVI) are down roughly 16% from their peak levels in September of last year. However, carriers are rejecting these requests at a higher rate — national rejection rates reached 5.7% last week, compared to 4.3% in early September. This suggests that the balance between supply (capacity) and demand is the closest it has been to equilibrium in the truckload market since 2022.
The Outbound Tender Reject Index (OTRI) measures the percentage of requests from shippers that truckload carriers turn down. Carriers generally avoid rejecting loads frequently, as doing so means turning away business. For this reason, rejection rates tend to remain relatively low.
The pandemic years of 2020-2021 were among the most challenging periods for securing transportation capacity. Between July 2020 and January 2022, the OTRI averaged above 23%, meaning carriers rejected nearly one out of every four loads due to insufficient availability.
Following this historically high period, the OTRI entered the opposite environment, averaging just 4.3% from July 2022 through last September — equivalent to about one out of every 25 loads being rejected.
Beginning in May 2023, the OTRI showed a slow but steady upward trend, coinciding with the market bottoming out in terms of oversupply. This period marked one of the easiest sourcing environments in recent history. However, last October, the OTRI’s upward movement accelerated. From May 2023 to September 2024, the OTRI rose from approximately 2.9% to 4.4%, averaging an increase of 8.8 basis points per month. Since late September, the OTRI has surged to 5.69%, rising at a rate of 25.5 bps per month — despite January and February typically being the slowest months of the year.
Some argue that the holidays and winter weather have inflated the OTRI, making these comparisons less meaningful. While this point has merit, it is important to note that tender volumes have declined significantly during this same period, which weakens that argument. Most of the holiday influence should have been flushed out at this point.
Last week’s chart of the week article highlighted the fact that carriers appear to be prioritizing loads coming off the West Coast in lieu of some of the Eastern markets, even in very well publicized markets with strong growth like Laredo, Texas.
In reality, carriers have consistently prioritized loads that offer the best financial and operational benefits throughout the downturn. However, this trend is now becoming more apparent as capacity tightens.
Large fleets have been parking and selling trucks over the past year. Werner reported a 9% y/y decline in active units in Q4 in its one-way TL segment and a 7% drop in dedicated units. Marten Transport showed a 3.5% reduction in TL and 15% in dedicated.
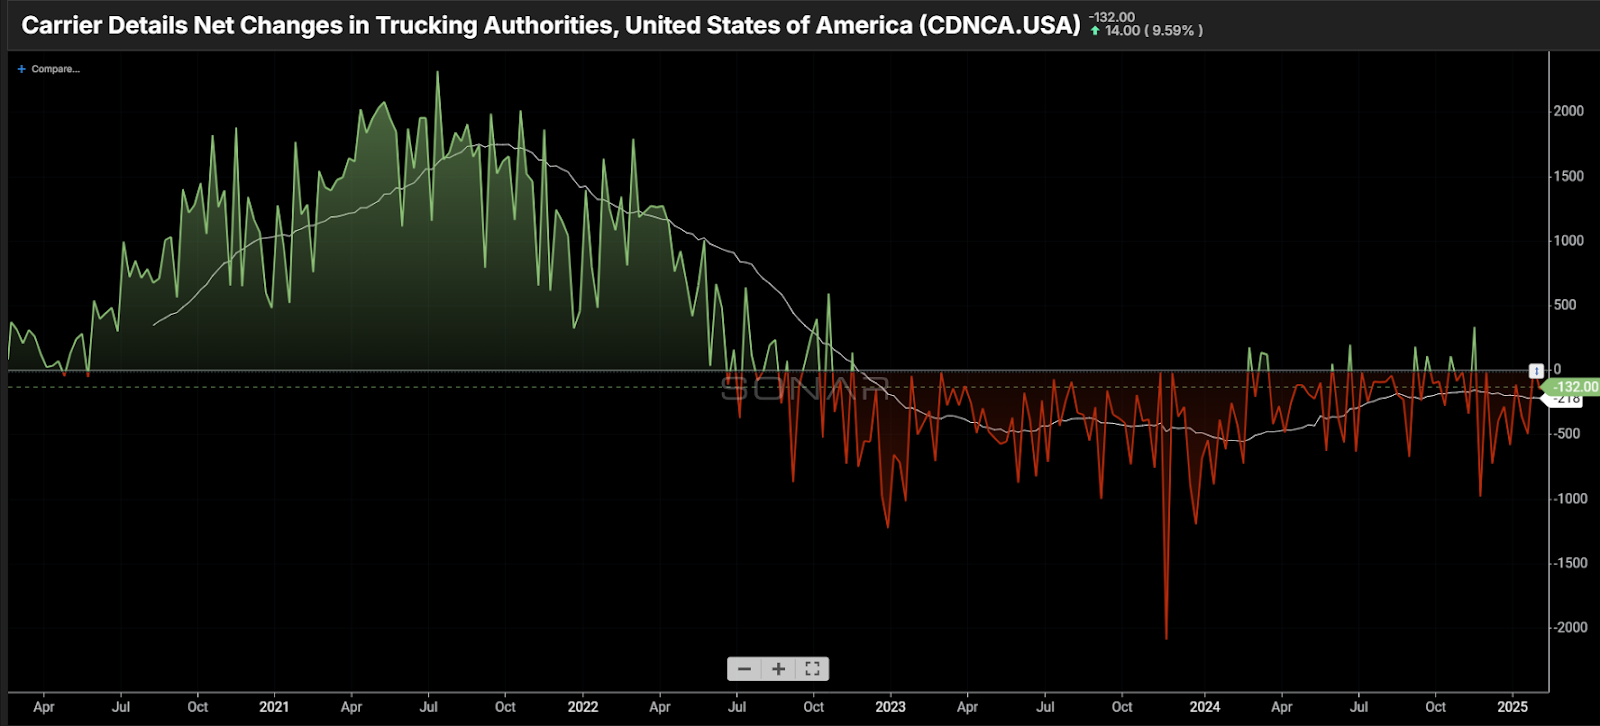
Since late September, the market has experienced a net loss of over 4,500 carriers, according to Carrier Details’ analysis of Federal Motor Carrier Safety Administration data. While most of these losses involve small fleets, this trend has been ongoing since late 2023. As capacity contracts, the underlying weaknesses in the market are becoming more visible — like rocks emerging as the tide recedes.
Over the past week, the OTVI fell by more than 7%, a very strong decline even considering seasonality. The OTRI barely reacted.
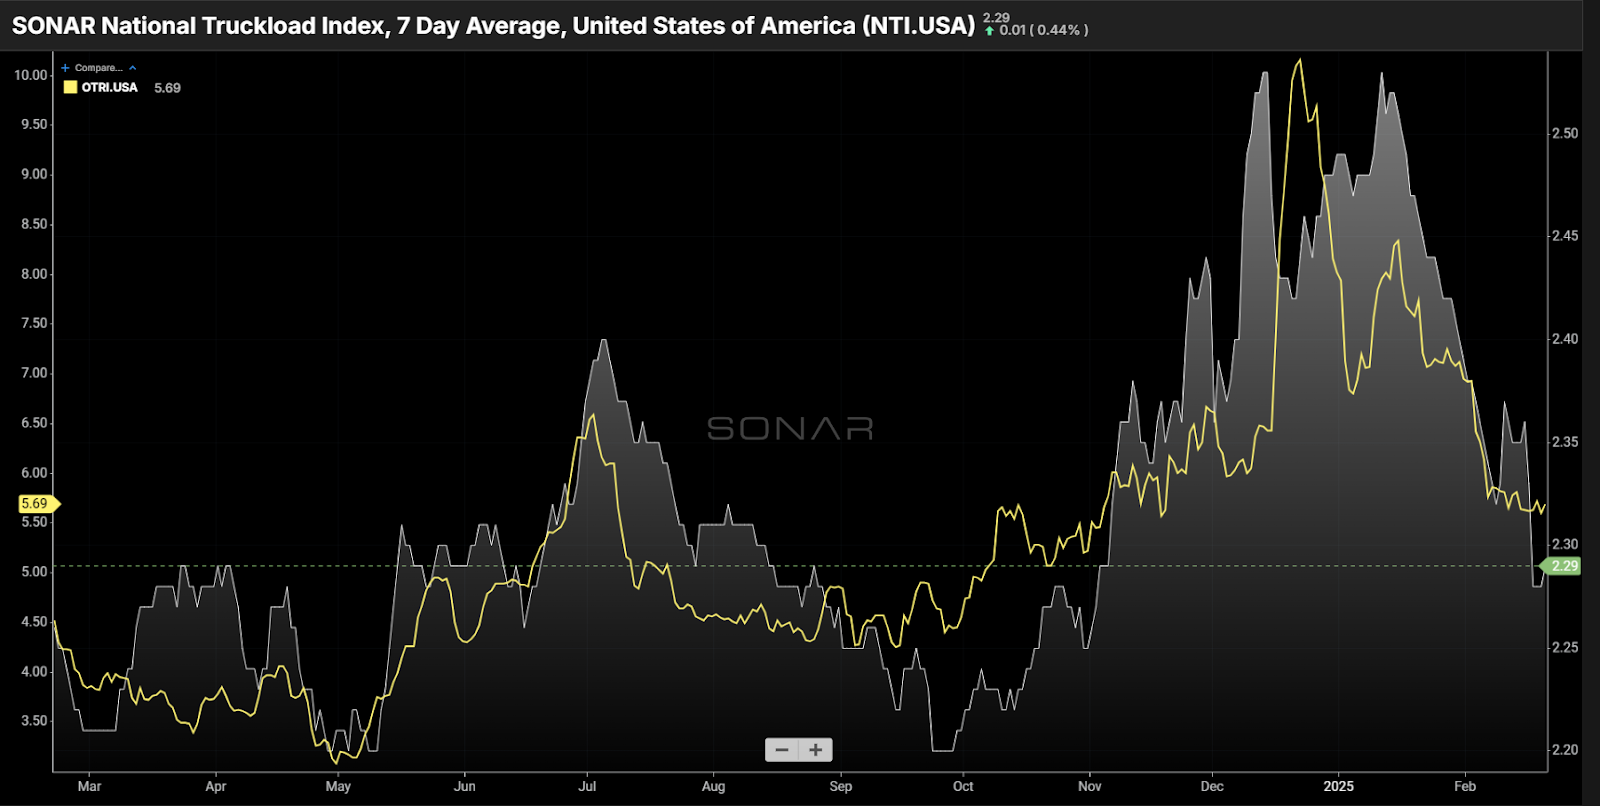
Unlike rejection rates, spot rates have been more volatile, experiencing a steep decline — aside from one brief increase — since mid-January. The takeaway is that a 5.5% rejection rate is still not high enough to drive inflationary spot rate activity. Additionally, rejection rates tend to be a more stable market indicator, as they are not subject to negotiation. In contrast, rapid shifts in market conditions often lead to exaggerated movements in rate negotiations.
The bottom line: The truckload market has tightened significantly in recent months – more than many realize. While slower demand has obscured signs of recovery, the market remains increasingly vulnerable to sharp shifts.
About the Chart of the Week
The FreightWaves Chart of the Week is a chart selection from SONAR that provides an interesting data point to describe the state of the freight markets. A chart is chosen from thousands of potential charts on SONAR to help participants visualize the freight market in real time. Each week a Market Expert will post a chart, along with commentary, live on the front page. After that, the Chart of the Week will be archived on FreightWaves.com for future reference.
SONAR aggregates data from hundreds of sources, presenting the data in charts and maps and providing commentary on what freight market experts want to know about the industry in real time.
The FreightWaves data science and product teams are releasing new datasets each week and enhancing the client experience.
To request a SONAR demo, click here.
The post Resilient rejection rates illustrate truckload capacity’s decline appeared first on FreightWaves.