


Winter spot rate slide a seasonal pattern
Rejection rate highs are getting higher, which means there is more potential for a significant softening that may feel like a full regression to some. The post Winter spot rate slide a seasonal pattern appeared first on FreightWaves.

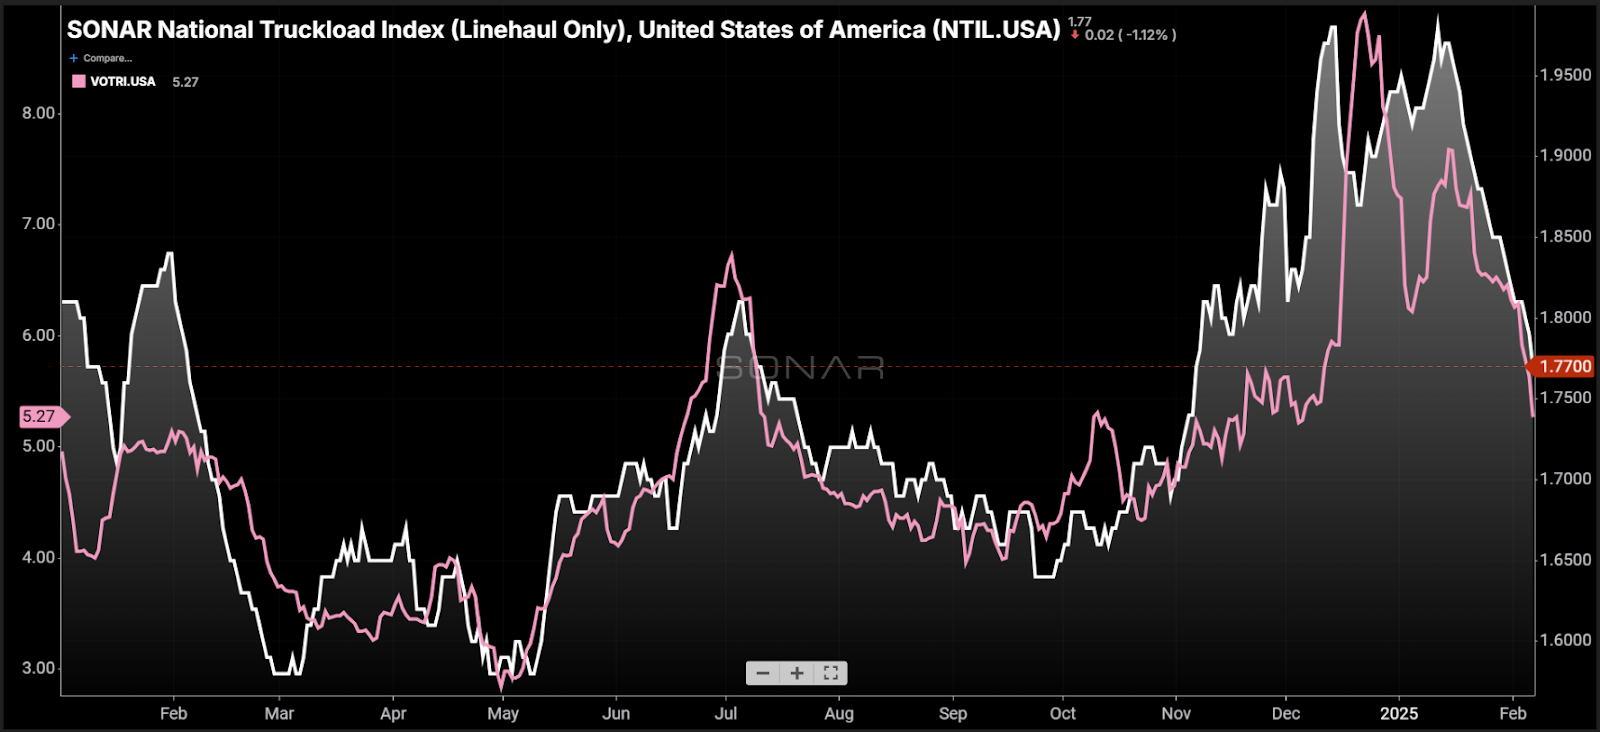
Chart of the Week: Spot (linehaul) to contract rate spread with spot fuel base at $1.20, Van Outbound Tender Rejection Index – USA SONAR: NTIL.USA, VOTRI.USA
National truckload spot and rejection rates for dry van loads have plummeted over the past week, indicating a rapid loosening of the domestic market. This decline may lead many to question the trucking market’s recovery, but the long-term trend still suggests that 2025 will be a more volatile year.
The National Truckload Index, excluding the total estimated cost of fuel (NTIL), has dropped 10% since Jan. 13. Dry van tender rejection rates have fallen from 7.7% on Jan. 14 to 5.3% on Thursday. While both declines are significant, they are also a result of the most reactive holiday market since 2022. Given the higher seasonal peak, there was more room for rates to fall.
Muted seasonality has been a defining characteristic of the post-pandemic freight recession. Spot and rejection rates have not reacted as sharply to holiday periods like Christmas and the Fourth of July.
The NTIL peaked at $1.80 during the 2023-24 holiday period, compared to $1.98 this year. Similarly, rejection rates for van loads peaked just above 5% in late 2023 but reached nearly 9% this past December. In other words, the highs are getting higher.
This also means there is more potential for significant softening, which may feel like a full regression to some.
Motion creates emotion
Strong movements in spot rates tend to be self-perpetuating. When brokers and carriers see rates rise rapidly, they often capitalize on the opportunity to increase earnings, reinforcing the trend. While this does not make the data any less real, it does make it a less reliable measure of pure market conditions.
Tender rejection rates, which reflect the frequency with which carriers decline customer requests for truckload capacity, are less influenced by human psychology. Unlike spot rates, they are not directly affected by subjective pricing strategies or inconsistent carrier cost structures, which can lead to rapid inflation and deflation.
Additionally, because tender rejection rates are not affected by inflation, they serve as a more reliable metric for year-over-year comparisons. Nonetheless, there remains a strong correlation between spot and rejection rates, even if the magnitude of their movements varies.
In sync
Both spot and rejection rates have fallen sharply at the start of the month, a highly seasonal pattern that typically occurs early in the year. Over the past two years, weather events have delayed or softened these declines, but this year, the drop has been more immediate.
As a result, the downturn may feel unusually strong, as most carriers and brokers anticipate a weaker market in January and February. Many may struggle to distinguish between long- and short-term trends, which can be difficult to separate at times.
Despite the recent declines, both rejection and spot rates remain higher than they were at this point last year. However, rejection rates are currently falling at a faster pace. This could be attributed to increased softness on the West Coast, where intermodal freight continues to take market share from trucking, combined with contract rate inflation.
For example, the average truckload contract rate from Los Angeles to Chicago has risen approximately 3% year over year. Meanwhile, dry van tender rejection rates out of Los Angeles have dropped from 5% to 3%. Higher rates may be keeping capacity more available in this region, whereas other markets have not experienced the same level of rate inflation.
Conversely, the Atlanta-to-Chicago lane has seen a slight annual rate reduction of 1%, a trend observed in many lanes originating from Atlanta. As a result, Atlanta rejection rates have increased from 2.3% to 3.7%, though the market remains relatively loose and has not tightened sufficiently to counterbalance the softness in the Los Angeles market.
Despite the sharp declines in spot and rejection rates, the broader market trajectory remains tighter, with signs pointing toward increased volatility in 2025. While the seasonal downturn is expected, the higher peaks seen in recent months suggest that future market fluctuations may be more pronounced. Regional disparities, such as the strength of contract rates in Los Angeles versus softer conditions in Atlanta, highlight the complexities at play in what is still a transitional market.
About the Chart of the Week
The FreightWaves Chart of the Week is a chart selection from SONAR that provides an interesting data point to describe the state of the freight markets. A chart is chosen from thousands of potential charts on SONAR to help participants visualize the freight market in real time. Each week a Market Expert will post a chart, along with commentary, live on the front page. After that, the Chart of the Week will be archived on FreightWaves.com for future reference.
SONAR aggregates data from hundreds of sources, presenting the data in charts and maps and providing commentary on what freight market experts want to know about the industry in real time.
The FreightWaves data science and product teams are releasing new datasets each week and enhancing the client experience.
To request a SONAR demo, click here.
The post Winter spot rate slide a seasonal pattern appeared first on FreightWaves.